

Here’s a shorter updated version of which fake news sites you should avoid.
“I challenge anybody to show me an example of bias in Fox News Channel.”
Challenge accepted.
Rupert Murdoch, the founder and current chairman of Fox Corp (owner of Fox News) first said the above quote in an article on the Salon website in 2001.
And even though it’s from almost 20 years ago, I can’t think of a more telling quote about the current environment of news in America.
Was there actually any iota of truth to that statement?
“Fake news!”
“Mainstream media!”
“Hoax!”
All of these phrases seem to be shouted from the rooftops everywhere we look these days.
On TV, on the internet, social media — even in private conversations with family and friends.
This has weighed on me (and probably you too) for a while now.
Not only have normally friendly conversations turned vitriolic, but it seems a candid discussion about actual facts is getting more and more impossible every day.
My curiosity finally got the best of me and I spent a huge amount of time over the last couple of weeks collecting and analyzing related data.
I explored the subject of what truly can be considered fake news today.
- Which sites are actually biased?
- Which news sources consistently provide more fiction than facts?
- How impactful are the relationships between reliability, bias, and traffic?
I explore these questions and many more in the following analysis.
For the main guide behind this topic, visit the parent guide.
Methods & sources
I’ll start off by sharing how and where I got the information to create this analysis. I feel, now more than ever, that there’s already far too much bias in the information on the web.
As such, I tried my best to remain neutral in the following analysis.
If you spot any errors or corrections needed, please comment and I’ll take a look.
Source #1: Ad Fontes Media
The initial data set I went to find was a statistically backed source of media bias and truthfulness.
This is a seemingly impossible task to accurately track.
Consider the thousands of news stories and opinion pieces that are published every single day.
Now multiply this by all of the blogs, opinion sites, and media organizations putting their own version of each story out into the web.
Then imagine that happens every single day, and multiply the numbers by decades.
It’s easy to see the insurmountability of such a project.
And yet — in steps Ad Fontes Media.
If you haven’t heard of them, they’re responsible for the Media Bias Chart.
The Media Bias Chart is a project that aims to evaluate as many major news sources in the U.S. as possible (within their budget limitations).
For every article they analyze, their panel of reviewers consists of 1 person leaning left, central, and right. They also have a meticulous methodology that needs to be followed.
You can read more about this project here. Currently, they are following and evaluating over 100 news organizations, while adding more when they can.
Source #2: The news websites
Unfortunately for my cookie history, part of my process involved visiting every single news site at least 5 times to evaluate their use of paywalls and revenue sources.
In the end, I settled on a list of 102 organizations that I was able to extract all of the same data from, for a proper comparison across the board.
Source #3: SEO tools
I also wanted to analyze news media website traffic. Most of this information is kept strictly private, likely due to competition and other factors.
Fortunately for this article, I was able to use two different SEO (Search Engine Optimization) tools to examine information such as:
- Total website traffic
- Unique monthly visitors
- US traffic (separated from the rest of the world)
For this analysis, I used two different SEO tools, SEMrush and SimilarWeb.
These tools are known to not be 100% accurate due to how they calculate their figures.
That being said, they are a good estimate of website traffic, amongst other things.
More importantly, they are great to use as a benchmark, as their methodology is applied equally to any website you query.
Because of the above aspects, I used both tools to average out the results to present a more accurate viewpoint.
Now let’s get to the meat of the analysis — and the findings.
Who Are the Least Biased News Sources?
Legend
I need to explain a few things before showing the results.
Firstly, we need to look at how Ad Fontes Media measures bias and reliability of news sources.
Bias
- Measured on a scale from -42 to +42
- Values from -6 to +6, I consider being mostly neutral
- Values lower than -18 and higher than +18 are approaching propaganda and can be considered extreme
- Ad Fontes measured “bias” based on Topic Selection and/or Presentation, Sentence Metrics, Comparisons (for bias by omission)
- Please read more about their complex and rigid methodology here
Reliability
- Measured on a scale from 0 to 64
- I ‘translated’ this data set to a direct percentage to be easier to understand
- The highest value is only 51.98 (81.2%), so please remember this while interpreting the data
- Values from 0 up to 16 can be considered extremely unreliable — literal fake news — “Serious reliability issues and/or extremism”
- Values from 16 up to 24 can be looked at as very questionable content — “Some reliability issues and/or extremism”
- Values from 24 up to 46 can be assumed to be reliable but may have a lot of opinions — “Reliable for news, but high in analysis/opinion content”
- Values from 46 to 64 are the most reliable for factual news — Read these news sources when you find them
- Ad Fontes measured “reliability” based on Element scores, Sentence scores, Unfairness instances
- Again, I encourage you to read more about their methodology if you have the time
Website traffic
- Website traffic data was collected for the month of July
- Website traffic data was reduced to only include visits from American locations
- 102 total websites analyzed (more were excluded due to lack of consistent information available)
Identifiers
- I used 3 different emoji’s to identify news sources based on their measurements
- 🔴 denotes conservative-leaning websites (higher than +6 on bias)
- 🔵 represents liberal-leaning websites (lower than -6 on bias)
- 🟢 is for neutral unbiased news sources (between -6 and +6)
Interesting data
- 34.5 (53.9%) average reliability score across the dataset
- 34 sources can be considered significantly liberal
- 28 sites can be considered significantly conservative
- 40 news sources were ranked as being neutral
- 63% of all of the publications are left-leaning, even if just a little bit. (Is this the source of the ‘Liberal News Mainstream Media’ trope?)
- 2.3 average monthly visits per user
- 4.6 billion visits from Americans for these 102 websites in July
- Each site had an average of 16.5 million unique Americans visited these websites in July
- The most unique visitors were Weather.com (185 million), CNN (174 million), and the New York Times (130 million)
- The least visited sites were Fiscal Times, World Truth TV, and FreeSpeech TV, with each having less than 100k unique American visitors in July
- I drank 17 coffees and 36 black teas while compiling this
Which websites can be considered ‘Fake News’?
This was one of the biggest questions that stuck out in my mind when I sat down to do this analysis.
The below list is any news source rated with a reliability factor of lower than 24 points (37.4%) according to Ad Fontes Media. News sources falling within these metrics can be considered to produce a significant amount of purposefully non-factual articles.
Be extremely skeptical when reading these news sources:
- 🔴World Truth TV — 11.6%
- 🟢National Enquirer — 15.1%
- 🔴The Gateway Pundit — 19.4%
- 🔴InfoWars — 20.3%
- 🔴NewsPunch — 22.5%
- 🔵Wonkette — 23.9%
- 🔴WorldNetDaily — 26.5%
- 🔴Twitchy — 26.7%
- 🔵Palmer Report — 27.6%
- 🔴PJ Media — 28.7%
- 🔵Bipartisan Report — 30.1%
- 🔵Occupy Democrats — 31.3%
- 🔴Breitbart — 32.2%
- 🔵Alternet — 33.4%
- 🔴Conservative Review — 34.1%
- 🔴The American Spectator — 34.4%
- 🔴The Federalist — 34.7%
- 🔵ShareBlue — 35.5%
- 🔵Crooks and Liars — 36%
- 🔴American Thinker — 36.1%
- 🔵Daily Kos — 36.2%
- 🔴Daily Caller — 37.4%
- 8 of the above 22 news sources can be considered to have a liberal bias, with 14 of 22 having a conservative bias
- 187 million total visits from Americans in July
- 47k (World Truth TV) to 13 million (Breitbart) unique visitors
- 3.3 average monthly visits per person
- Every one of these websites can be considered very biased as well as very unreliable for factual information — with the odd exception of a neutrally ranked National Enquirer
Which news sources should we be reading?
Amongst all the clutter of thousands of news articles being pumped out every day, how are we to know if it’s reliable, factual, and not biased?
This is an important question, and according to the following data, these are the sites we should trust the most.
To calculate this, I used both metrics of reliability and bias, measured by Ad Fontes Media. I did a basic multiplication of the two data sets and weighted them equally.
The aim was to rank the publications by the least amount of bias with the most amount of reliability in their reporting.
The following 15 news sources ranked the highest under this metric.
- 🟢AP, 79.2%
- 🟢Reuters, 78.9%
- 🟢Weather.com, 75.9%
- 🟢ABC News, 73.9%
- 🟢The Advocate, 73.9%
- 🟢Bloomberg, 72.9%
- 🟢National Public Radio, 72.9%
- 🟢Wall Street Journal, 72.1%
- 🟢The Hill, 72.1%
- 🟢Financial Times, 71.9%
- 🟢LA Times, 70.8%
- 🟢PBS, 70.6%
- 🟢Al Jazeera, 70.5%
- 🟢CBS, 70.3%
- 🟢Fortune, 69.8%
- None of the above news sources have a high enough score to be considered as being biased (their reporting is largely neutral in terms of politics — a very good thing)
- 1.169 billion visits by Americans in July
- Average of 1.9 visits per user monthly
Who are the 10 most biased news sources?
News organizations used to be a bastion of reliability. But somewhere in the past few decades, the idea that opinions could be substituted for facts became acceptable.
In my humble opinion, bias should be kept out of the news, as much as possible.
And from that viewpoint — here are the 10 worst offenders for having the most bias according to Ad Fontes Media.
(Remember, the bias rankings are on a scale of -42 to +42. The more negative the bias ranking, the more liberal. The more positive it is, the more conservative it’s considered.)
Avoid these sources if you value neutrality:
- 🔵Wonkette, -31.15
- 🔴InfoWars, 31.05
- 🔴American Thinker, 29.82
- 🔵Palmer Report, -29.37
- 🔴NewsPunch, 28.58
- 🔴The Gateway Pundit, 28.55
- 🔵Occupy Democrats, -25.59
- 🔴Conservative Review, 25.3
- 🔵ShareBlue, -24.95
- 🔴Life News, 24.75
- These websites get almost 44 million visits from Americans each month
- The number of unique individuals visiting each site ranges from 150k (ShareBlue) to 4 million (The Gateway Pundit)
- They are visited 3 times per month on average (a high value for the online news industry)
Who are the 10 most neutral news sources?
This list shows who is consistently rated to be the most unbiased site of the 102 websites in this analysis.
News media to consider the most neutral sources:
- 🟢The Hill, 0.09
- 🟢Forbes, 0.2
- 🟢Christian Science Monitor, -0.21
- 🟢Business Insider, -0.38
- 🟢Fortune, 0.43
- 🟢Marketwatch, -0.54
- 🟢Financial Times, 0.62
- 🟢Bloomberg, -0.85
- 🟢Reuters, -0.95
- 🟢AP, -1.06
- These websites are visited almost 504 million times by Americans every month
- The number of unique Americans visiting these websites ranges from 600k (Christian Science Monitor) to 69 million (Business Insider)
- They are visited roughly 1.9 times per user each month.
Who are the 10 most liberally biased news sources?
- 🔵Wonkette, -31.15
- 🔵Palmer Report, -29.37
- 🔵Occupy Democrats, -25.59
- 🔵ShareBlue, -24.95
- 🔵Truthout, -24.4
- 🔵Bipartisan Report, -23.55
- 🔵Crooks and Liars, -23.46
- 🔵Second Nexus, -22.61
- 🔵FreeSpeech TV, -22.49
- 🔵Daily Kos, -21.49
- Visited 38 million times in July
- 70k (FreeSpeech TV) to 3.9 million (Daily Kos) unique visitors
- 3.5 average monthly visits per person
Who are the 10 most conservatively biased news sources?
- 🔴InfoWars, 31.05
- 🔴American Thinker, 29.82
- 🔴NewsPunch, 28.58
- 🔴The Gateway Pundit, 28.55
- 🔴Conservative Review, 25.3
- 🔴Life News, 24.75
- 🔴The American Spectator, 23.89
- 🔴Daily Signal, 23.31
- 🔴The Federalist, 23.29
- 🔴WorldNetDaily, 22.92
- Visited 49 million times in July
- 380k (The American Spectator) to 3.9 million (The Gateway Pundit)
- 2.6 average monthly visits
What news websites get the most traffic in the USA?
The following websites all received over 100 million total visits from people in the USA in July, 2020.
- 🟢CNN — 742,371,890 total visits from American IP’s
- 🟢Weather.com — 668,129,829
- 🔴Fox News — 426,550,743
- 🟢New York Times — 327,664,512
- 🟢Washington Post — 179,578,280
- 🟢BBC — 170,825,945
- 🟢Daily Mail — 155,024,495
- 🔵The Guardian — 134,269,014
- 🟢USA Today — 119,723,175
- 🟢Forbes — 106,020,684
- 🟢Business Insider — 103,012,877
- 🟢New York Post — 102,145,476
- 3.23 billion total visits in July
- 41 million (Daily Mail) to 175 million (CNN) unique Americans visited
- 2.9 average monthly visits
Which sites can be considered contributors to echo-chambers?
Measuring the echo-chamber effect isn’t inherently intuitive. To come up with this ranking, I matched the two metrics of reliability and site visits per month.
The line of thought is that ‘fake news’ websites are more likely to write strong opinions without the benefit of truth behind them.
If these websites also had a strong correlation of repeat visitors — I would say that is an echo chamber of strong believers in ideology, rather than facts.
Also remember, the visits per month is an average. Some people can be visiting far more — and likely to believe what they are reading.
Based on the data and in my opinion, the following websites are harming the news industry and our political discourse.
- 🔵Palmer Report — 27.6% reliability score, 8.2 average monthly visits
- 🔵Crooks and Liars — 36%, 6.2
- 🔵Daily Kos — 36.2%, 5.3
- 🔴Breitbart — 32.2%, 5.3
- 🔴Twitchy — 26.7%, 5.1
- 🔴Fox News — 41.8%, 4.9
- 🔴The Gateway Pundit — 19.4%, 4.8
- 🔴PJ Media — 28.7%, 4.4
- 🔴InfoWars — 20.3%, 4.3
- 🔵FreeSpeech TV — 38.7%, 4.0
- 🔴RedState — 41.3%, 3.7
- 🔵Wonkette — 23.9%, 3.6
- 🔴American Thinker — 36.1%, 3.6
- 🔵Alternet — 33.4%, 3.2
- 🔴Daily Caller — 37.4, 3.1
- 🔴Daily Wire — 38.1%, 3.0
How many news sources use paywalls?
21 of the 102 sources analyzed had some form of paywall from my discovery. This wasn’t a perfect method, so it’s possible I missed one or two news sources.
I went on every single news site and clicked/skimmed through 5 different articles. If a paywall prompt opened up at any point in that journey, I marked it down.
In the below list, anything over 62.5% is considered to be pretty reliable by Ad Fontes Media. I bolded the ones below that can be considered reliable sources.
Paywalled news sources:
- 🔴Daily Wire, 38.1%
- 🟢Marketwatch, 70.0%
- 🟢Talking Points Memo, 65.6%
- 🟢New York Times, 74.2%
- 🟢Bloomberg, 74.4%
- 🟢Washington Post, 68.3%
- 🟢Wall Street Journal, 75.5%
- 🟢Financial Times, 73.0%
- 🔴National Review, 41.2%
- 🟢The Economist, 66.2%
- 🟢Christian Science Monitor, 69.5%
- 🔵The New Yorker, 65.4%
- 🟢LA Times, 76.4%
- 🔴Washington Times, 49.0%
- 🟢Business Insider, 67.4%
- 🔵The Atlantic, 62.8%
- 🔵New Republic, 56.9%
- 🔵Vanity Fair, 55.3%
- 🟢Foreign Policy, 64.8%
- 🔵The Nation, 52.2%
- 🟢Quartz, 64.6%
- Interestingly, most of the above sites are considered neutral and reliable news sources. It leads to a question of whether or not paywalls limit truthful information being disseminated enough. An article for another day, perhaps.
- From the list above, every non-reliable news source has a political leaning. This also includes 100% of the above conservative-leaning sources.
- 1 billion visits from Americans in July vs 4.6 billion visits from the entire data set of 102 news sources
- 560k (Christian Science Monitor) to 130 million (New York Times) unique visitors in July
- Interestingly, only 1.9 average monthly visits for these sources (perhaps it’s less because of the paywall?
Want more interesting stories in your inbox? Join Pryor Thoughts for free today!
I am not a data scientist although I have studied the subject as part of my two university degrees in the past.
To make sure I was on the right track, I ran this article by a friend of mine that is a professional quantitative analyst.
Based on his advice, I have left out any conclusions to the following data — I merely present my opinion.
Some correlations were shown to be statistically significant, while others showed very little numerical relationships.
I’ll leave you to be the judge of which ones may or may not be.
Website visits vs News media bias
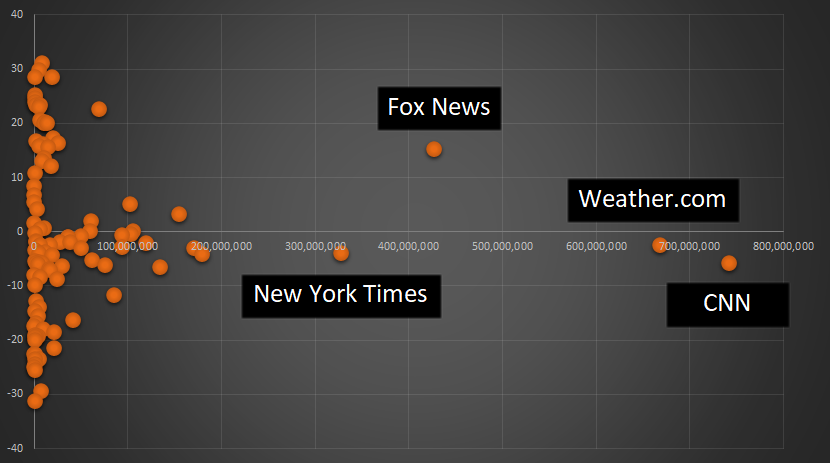
I was curious to see if the popularity of a news source affected its bias.
I don’t believe there is a strong relationship in the data, but it is interesting to note the most popular sites are all relatively unbiased — with the exception of Fox News, as denoted above.
Reliability vs Unique American visitors in July
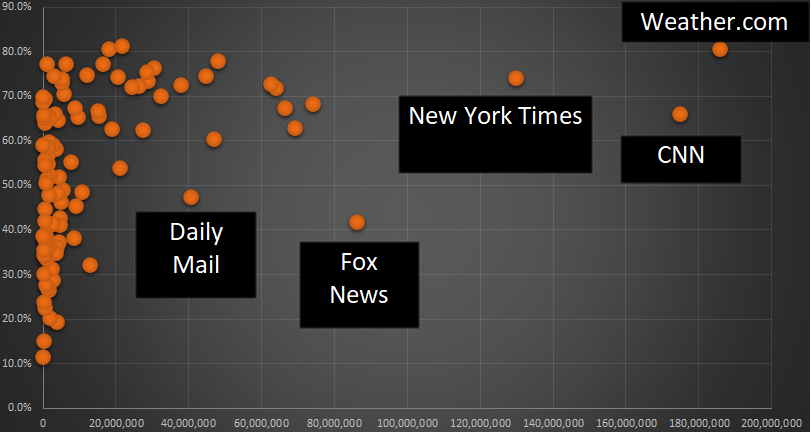
It’s important to know if our most popular sources of news are reliable. I thought this would be an interesting graph to visualize because of this.
Fortunately, most of the most popular sources can be considered reliable, with Weather.com having the most visitors as well as being the most reliable.
On the other side of things, we can see two of the more unreliable but popular websites are outliers — Fox News and the Daily Mail.
Bias vs Reliability
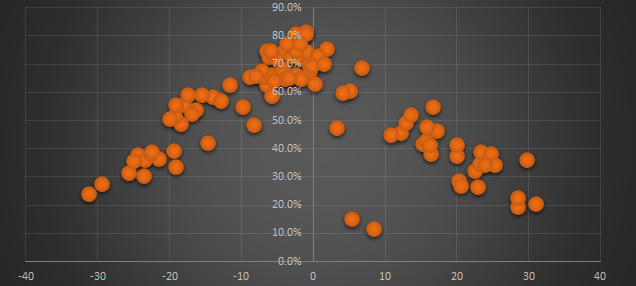
On this chart, we can see measured bias vs measured reliability. The horizontal axis is divided by a line measuring reliability.
- Essentially, the closer to the middle a data point, the less biased it is.
- The higher up a data point, the more reliable that news source is considered.
It’s nice to see a strong connection between highly reliable sites and their unbiasedness — a position I believe all proper news sites should strive for.
On the opposite side, it seems the more biased a website is — whether right or left — the more fake news they spew out into the world to absorb.
This chart also shows an interesting feature of the data set — 63% of all of the publications are left-leaning, even if a little bit.
Monthly visits per person vs Reliability
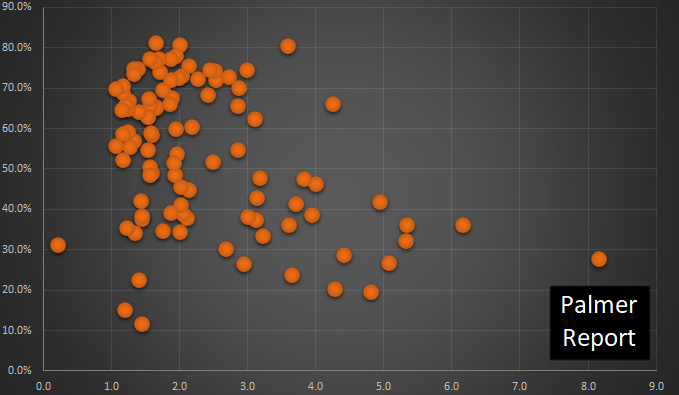
Another attempt at trying to see evidence of an echo-chamber effect. Some websites such as the Palmer Report have a very high rate of repeated visits.
Unfortunately for neutrality, several of these are assessed to be very unreliable, if not extremist.
It also shows that most of the highly reliable news sources are not visited that frequently. The one exception to that is Weather.com, with 3.6 average visits per month per user.
A bit ironic since I can’t remember the last time my weather app accurately forecast the rain. (/s)
Commentary
I spent an incredible amount of time on this article. By far the most I’ve ever done for a single piece.
The constant anger, arguments, and contempt we see in our everyday lives spurred me on to gather and analyze this dataset.
And yet, I find myself now with even more questions than I was able to answer in creating this article.
- How can we stop such bias from infecting the national discourse?
- Where is the line between allowing propaganda to permeate freely versus free speech? Is this an absolute argument, or can we somehow find a line to discern the truth from fiction?
- Can we please stop listening to tinfoil hat-wearing maniacs?
As you can see from some of the data above, there are many sites that are clearly spreading false information, opinion, and extremism.
This does not bring us together.
It leads to us doubting our neighbors, our friends, our parents, and other important people in our lives.
Eternal distrust.
You can’t believe what you hear.
Every man for himself.
It seems that many people these days, mistakenly in my opinion, search for sources based on what they already want to hear.
They look for articles to confirm their suspicions. Their thoughts and feelings.
Right or left, it doesn’t matter. If you search on Google for something to back up your feeling on a subject (regardless of truth) — you will find it.
There’s an article for everything now.
Opinions being added to the news cycle has corrupted the impartiality of it.
This is not how we come together as a world, as a nation.
We must be better than this.
It’s my belief that many of these websites, their owners, and their anchors are one of the largest absolute causes of anger in the world today.
Be better, people.
I’ll close off by stating my most nagging thought after conducting this extensive exercise — I couldn’t wait to clear my browser cookies fast enough.
If you noticed any glaring errors please let me know in the comments section. I’ll try my best to respond to any other questions and comments as well.
J.J. Pryor
Want more interesting stories in your inbox? Join Pryor Thoughts for free today.
Note to help the author: I also released a satirical adult children’s political satire book — for those with a bit of dark quirky humor, please feel free to check it out.


Full list of news websites analyzed:
For anyone interested in the data from Ad Fontes Media, here are the basics I used from their available information.
Remember their metrics:
- Reliability is measured on a scale from 0 to 64 (unreliable to reliable).
- Bias is measured from -42 to +42 (left to right).
+---------------------------+-------------+--------+
|     News Source           | Reliability |  Bias  |
+---------------------------+-------------+--------+
| ABC news                  |       49.47 |  -1.85 |
| Al Jazeera                |       49.47 |  -3.71 |
| Alternet                  |        21.4 | -19.16 |
| American Thinker          |        23.1 |  29.82 |
| AP                        |       51.98 |  -1.06 |
| Axios                     |       47.36 |  -5.74 |
| BBC                       |       46.56 |  -3.03 |
| Bipartisan Report         |       19.29 | -23.55 |
| Bloomberg                 |       47.63 |  -0.85 |
| Breitbart                 |       20.58 |  22.57 |
| Business Insider          |       43.13 |  -0.38 |
| BuzzFeed                  |        43.2 |  -7.06 |
| CBS                       |       47.06 |  -1.85 |
| Christian Science Monitor |       44.47 |  -0.21 |
| CNN                       |       42.22 |  -5.69 |
| Conservative Review       |        21.8 |   25.3 |
| Conservative Tribune      |       29.69 |  17.22 |
| Counterpunch              |       25.06 | -19.38 |
| Crooks and Liars          |       23.06 | -23.46 |
| Daily Beast               |       34.44 | -16.25 |
| Daily Caller              |       23.93 |  20.06 |
| Daily Kos                 |       23.16 | -21.49 |
| Daily Mail                |       30.36 |   3.27 |
| Daily Signal              |       24.79 |  23.31 |
| Daily Wire                |       24.39 |  16.35 |
| Democracy Now             |       32.91 | -19.31 |
| Financial Times           |       46.71 |   0.62 |
| Fiscal Times              |       44.72 |   1.52 |
| Forbes                    |       40.27 |    0.2 |
| Foreign Policy            |       41.49 |  -1.65 |
| Fortune                   |       45.15 |   0.43 |
| Forward                   |       37.57 |  -5.69 |
| Fox News                  |       26.76 |  15.31 |
| FreeSpeech TV             |       24.77 | -22.49 |
| Huffington Post           |       39.98 | -11.64 |
| IJR                       |          44 |   6.73 |
| InfoWars                  |       12.97 |  31.05 |
| Intercept                 |       37.76 | -15.52 |
| Jacobin                   |       32.32 | -19.92 |
| LA Times                  |       48.88 |  -3.06 |
| Life News                 |       24.49 |  24.75 |
| Marketwatch               |        44.8 |  -0.54 |
| Mother Jones              |       37.31 | -13.92 |
| MSNBC                     |       46.39 |  -6.11 |
| National Enquirer         |        9.65 |   5.41 |
| National Public Radio     |        49.9 |  -2.73 |
| National Review           |       26.36 |  16.23 |
| New Republic              |       36.43 | -12.82 |
| New York Post             |        38.7 |   5.15 |
| New York Times            |        47.5 |  -4.01 |
| News and Guts             |       34.98 |  -9.84 |
| NewsMax                   |       33.15 |  13.61 |
| NewsPunch                 |       14.39 |  28.58 |
| Newsy                     |        42.1 |     -8 |
| Occupy Democrats          |          20 | -25.59 |
| One America News Network  |       30.57 |  15.89 |
| OZY                       |       40.99 |  -5.43 |
| Palmer Report             |       17.66 | -29.37 |
| PBS                       |       47.86 |  -2.37 |
| PJ Media                  |       18.36 |  20.33 |
| Politico                  |       46.11 |  -5.24 |
| ProPublica                |       47.78 |  -5.93 |
| Quartz                    |       41.34 |  -3.89 |
| Reason                    |       38.27 |   4.12 |
| RedState                  |       26.44 |  20.08 |
| Reuters                   |       51.64 |  -0.95 |
| Second Nexus              |       24.29 | -22.61 |
| ShareBlue                 |       22.71 | -24.95 |
| Slate                     |       31.12 | -18.47 |
| Talking Points Memo       |       41.96 |  -5.67 |
| The Advocate              |       49.47 |  -1.85 |
| The American Conservative |       28.65 |  10.82 |
| The American Spectator    |          22 |  23.89 |
| The Atlantic              |       40.16 |  -6.41 |
| The Blaze                 |       27.34 |   15.7 |
| The Economist             |       42.34 |  -2.43 |
| The Federalist            |       22.23 |  23.29 |
| The Gateway Pundit        |       12.44 |  28.55 |
| The Guardian              |       47.66 |  -6.45 |
| The Hill                  |       46.23 |   0.09 |
| The Nation                |       33.39 | -16.89 |
| The New Yorker            |       41.85 |   -6.9 |
| The Progressive           |       37.79 | -17.48 |
| The Skimm                 |       41.67 |  -3.31 |
| The Week                  |       30.98 |  -8.31 |
| Think Progress            |       35.59 | -19.12 |
| Time                      |        42.7 |  -4.35 |
| Truthout                  |       24.07 |  -24.4 |
| Twitchy                   |       17.08 |  20.57 |
| USA Today                 |       46.07 |  -2.03 |
| Vanity Fair               |       35.42 | -17.98 |
| Vox                       |       41.97 |  -8.75 |
| Wall Street Journal       |       48.33 |   1.89 |
| Washington Examiner       |       29.07 |  12.17 |
| Washington Free Beacon    |       35.07 |  16.71 |
| Washington Monthly        |       26.91 | -14.68 |
| Washington Post           |       43.73 |  -4.18 |
| Washington Times          |       31.34 |  12.97 |
| Weather.com               |       51.55 |  -2.43 |
| Wonkette                  |       15.27 | -31.15 |
| World Truth TV            |        7.41 |   8.48 |
| WorldNetDaily             |       16.95 |  22.92 |
+---------------------------+-------------+--------+


I need help understanding the methodology and conclusions used here if you can state that NPR is unbiased. They are one of the most liberal news sources I have heard.
Hi David, if you go to the NewsBias website linked in the article (Media Bias Chart from AdFontes Media), they have a very detailed guide on how they evaluate news sites and try to systematically maintain unbiasedness. Take care.
I was surprised to see some of your findings. A news source can be judged as reliable and unbiased based upon what they choose to report on. However, does your study consider what they choose not to report on. Is that not a form of bias, manipulation, and censorship?
That’s a valid point Don. I’d suggest going to the Ad Fontes Media page where it describes (at length) their process for evaluation. From what I remember, your suggestion probably isn’t taken into account. I’d imagine it’s a pretty insanely complex task to try to find out what ‘wasn’t’ included in the news that day. Still, it would be great to have that info in the future.
Is there some place is can find out about the bias of 1440 News? I have a family member who follows it because it claims to present unbiased news, but the co-founder and CEO is Tim Huelskamp, a strong social conservative and former chairman of the House Tea Party Caucus.
How can anyone say your findings are unbiased when there is an anti-trump propaganda book advertised at the bottom of your article. Might I recommend to either remove it or add another book making fun of the left ? You know, to keep things equal?
It’s laughable that NPR, CNN, and NYT are considered minimally biased.
Most conservatives I know readily recognize and admit the biases of “their” media outlets, but I don’t know a single liberal about which I can say the same.
I think this element factors into your bias scores, but I doubt there’s any real way to correct for it.
No review of this sort is adequate without considering evidence of outright censorship. The entirety of the Covid media fiasco is one huge episode of this. Sharyl Attkisson’s “Follow the Science” Dr. Ardis ‘Moving Beyond Covid-19 Lies” now Dr. Robert Malone’s “PsyWar” are being censored as they demolish the foundation of the Government-Media Machine that is STILL fronting for Big Pharma. There was a nasal spray that killed Covid in your nose in Oct.2021 (SanOtize by Enovid Pharma) still not a single mention on US media. C-Span did let Dr. Malone on but nobody else so far. Sharyl’s “Full Measure” program and site do stories the others don’t so SHE is censored.She just did one on how Ivermectin works.
And as for the NY Times “newspaper of record”. The book “The Gray Lady Winked” is censored too. Look it up and you’ll see why.